🔥 Learn about the latest feature releases, product improvements, and bug fixes.
Iventis can now support highly detailed terrain models from a variety of sources. These provide a high degree of topographical accuracy when planning. Iventis can provide data from different providers, or incorporate custom survey data. Speak to support for more info (support@iventis.com).
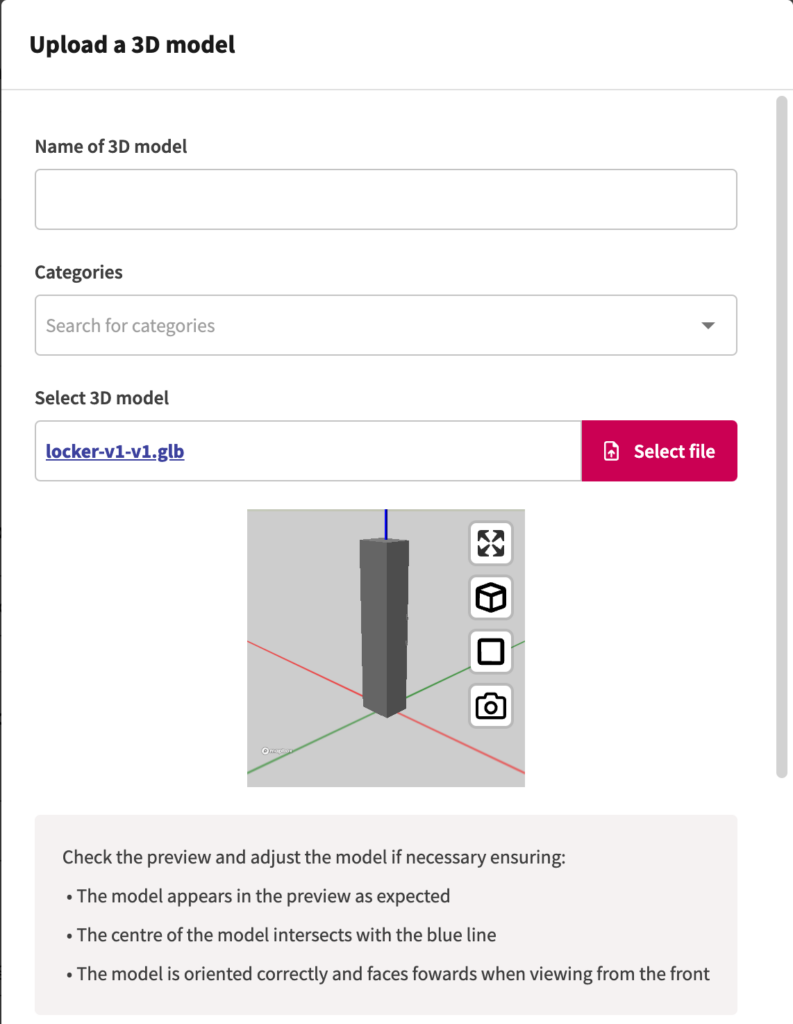
Uploading 3D models is now easier with a preview, check-list and thumbnail generator.
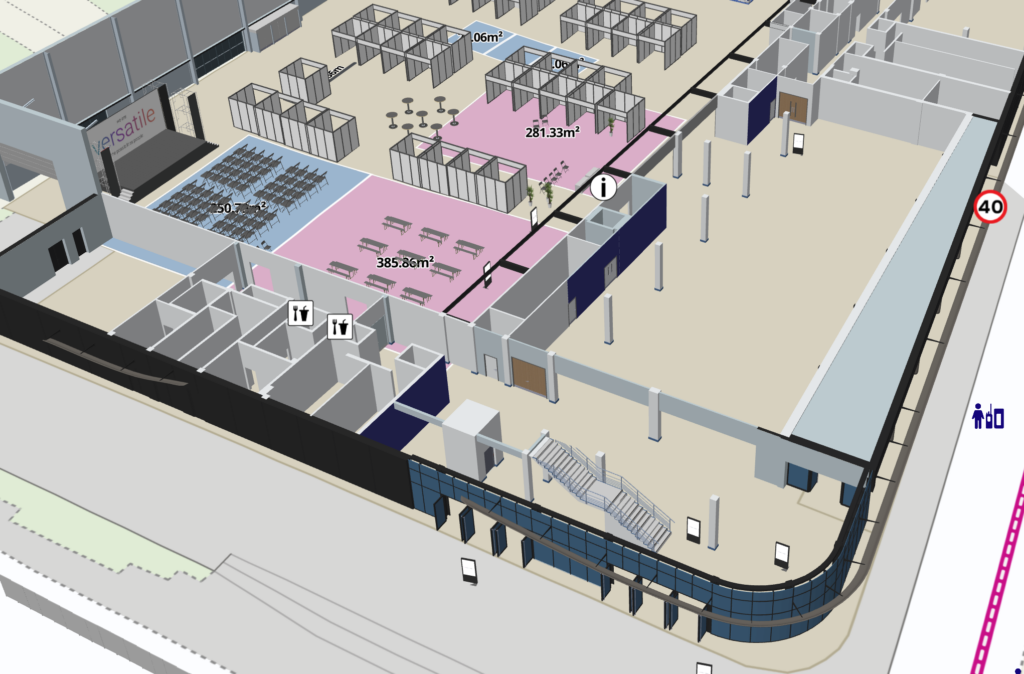
Our 3D rendering engine has been improved. This provides better performance and visual quality. 3D models now also appear on top of terrain.
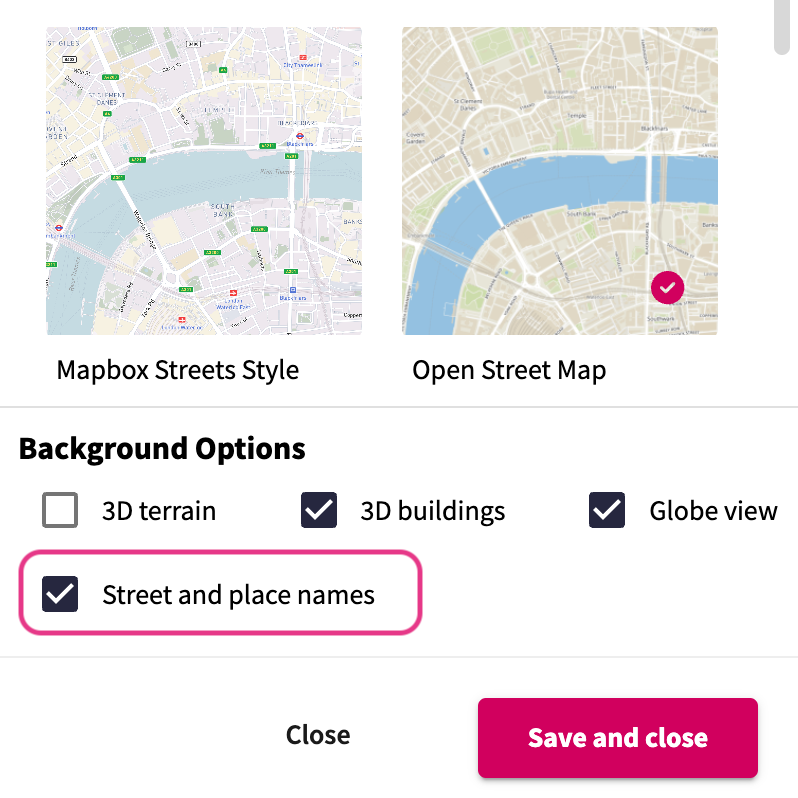
Street names and other place labels can be switched on/off on any background map, including satellite imagery. This is helpful if you want a cleaner map without text labels.
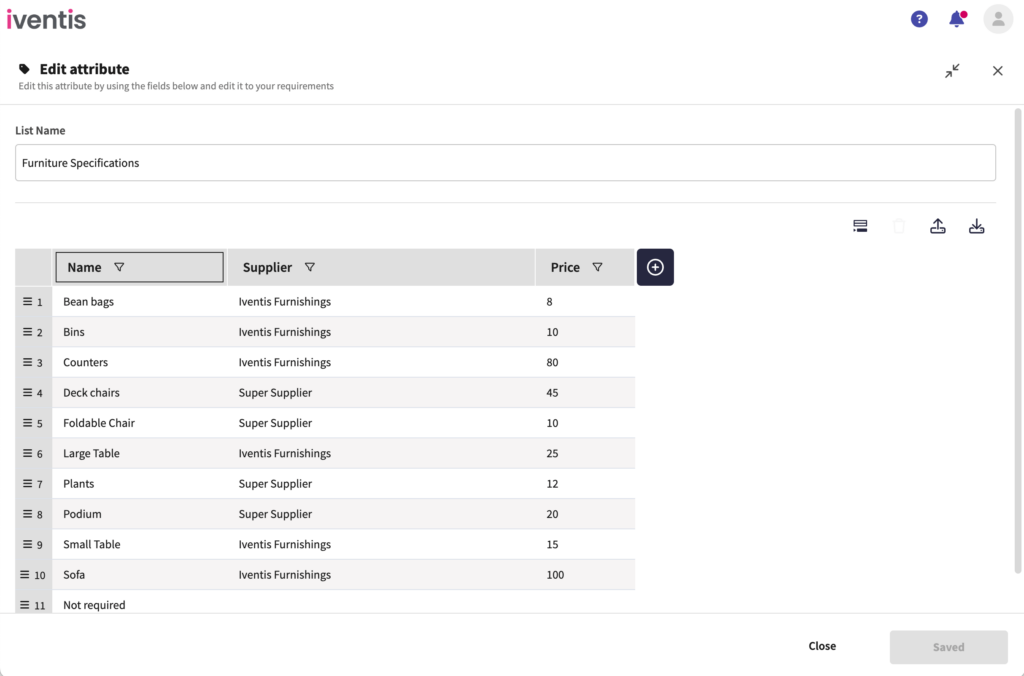
When editing list attributes, columns can now be resized and the table can be made full-screen. This is helpful when editing larger tables.
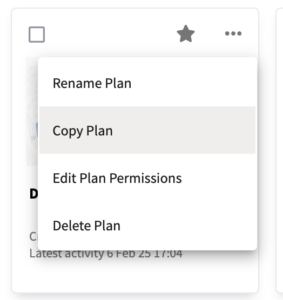
Users can now make copies of a plan, multiple plans or entire folders. This is helpful when using plans as templates, creating new versions or copying an event plan for a future edition.
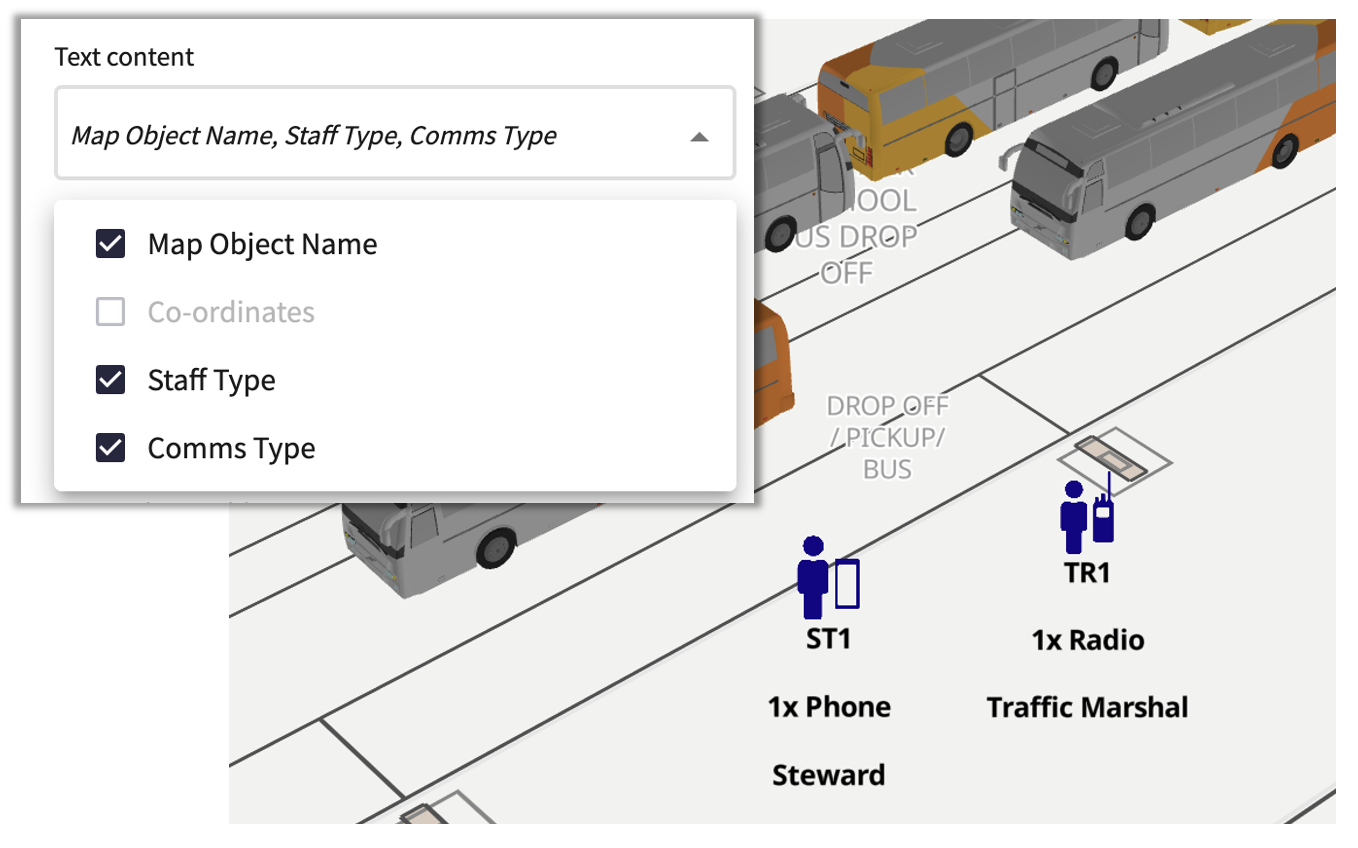
It is now possible to select more than one attribute to show in a text label. This helps show more information about objects directly on the map. It is particularly useful when creating PDF exports.
The length of straight lines can now be set by editing the object details panel. This helps to accurately create lines of a specific distance.
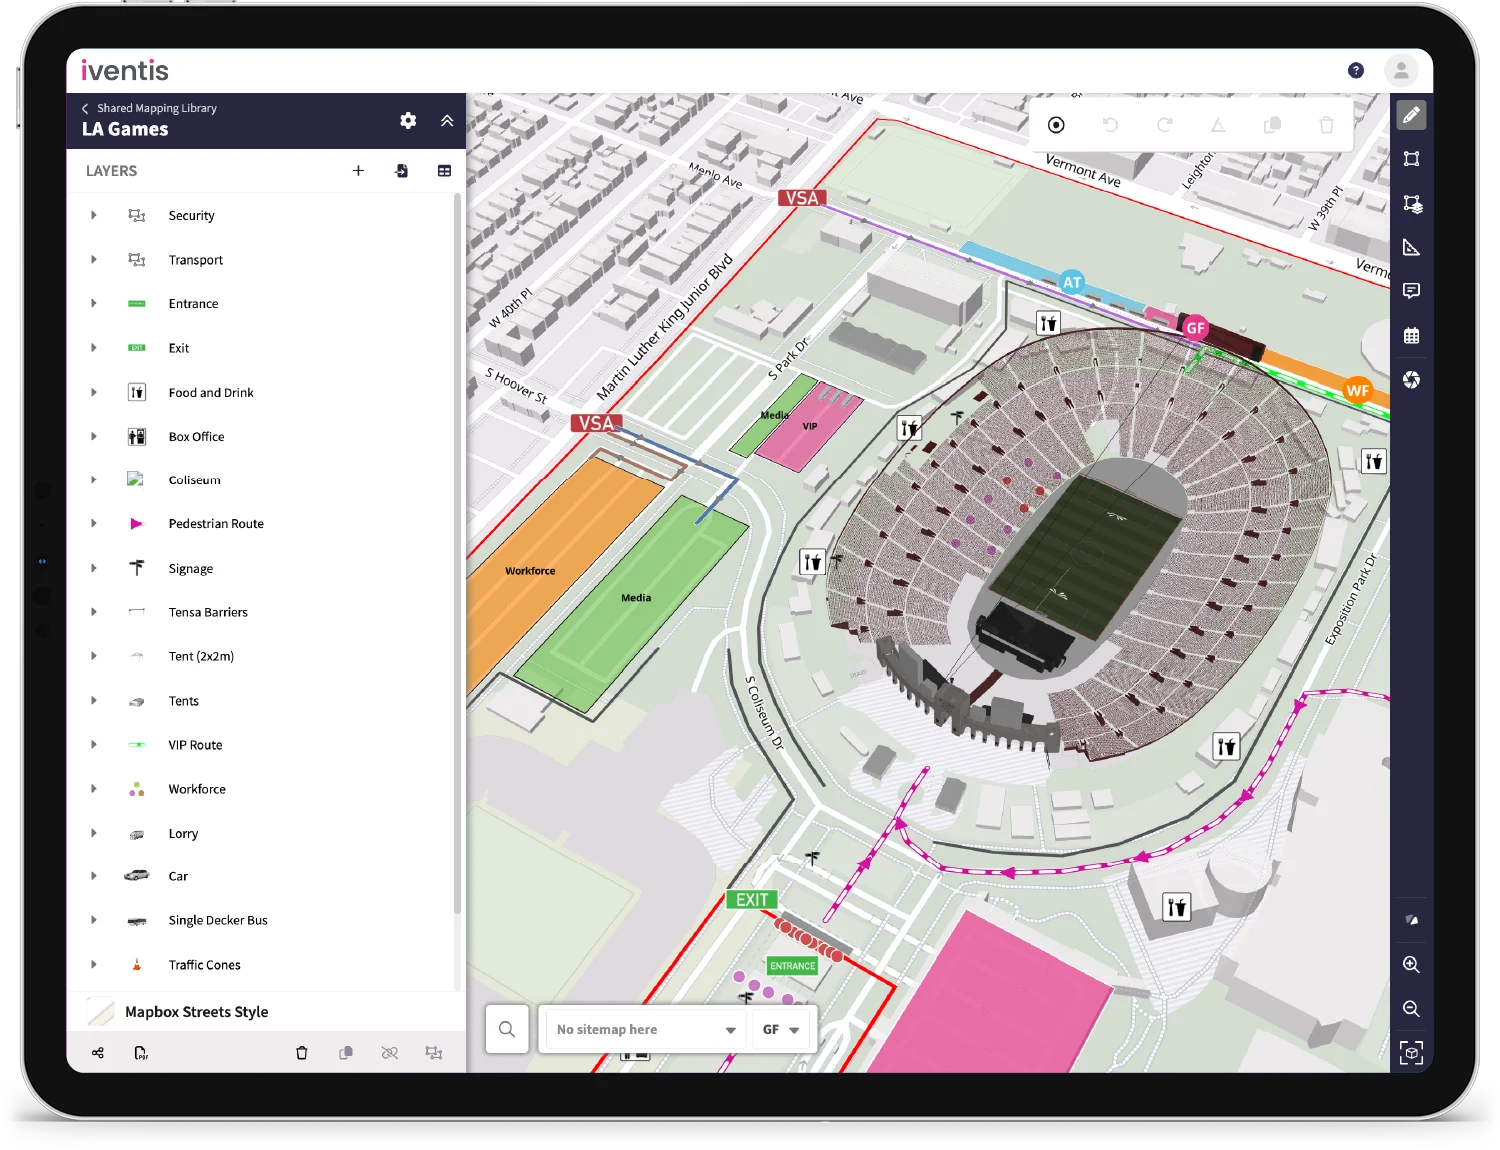
We have revamped the main toolbar in the map to make editing your plans even easier. We’ve merged the key functionality from our previous two toolbars into one simple toolbar centred at the top of the screen.
You can easily access key features including:
Enable snapping from the new toolbar while drawing to snap different objects together. This allows for more precise drawing where objects need to be aligned such as trade stands, parking spaces, routes and more.
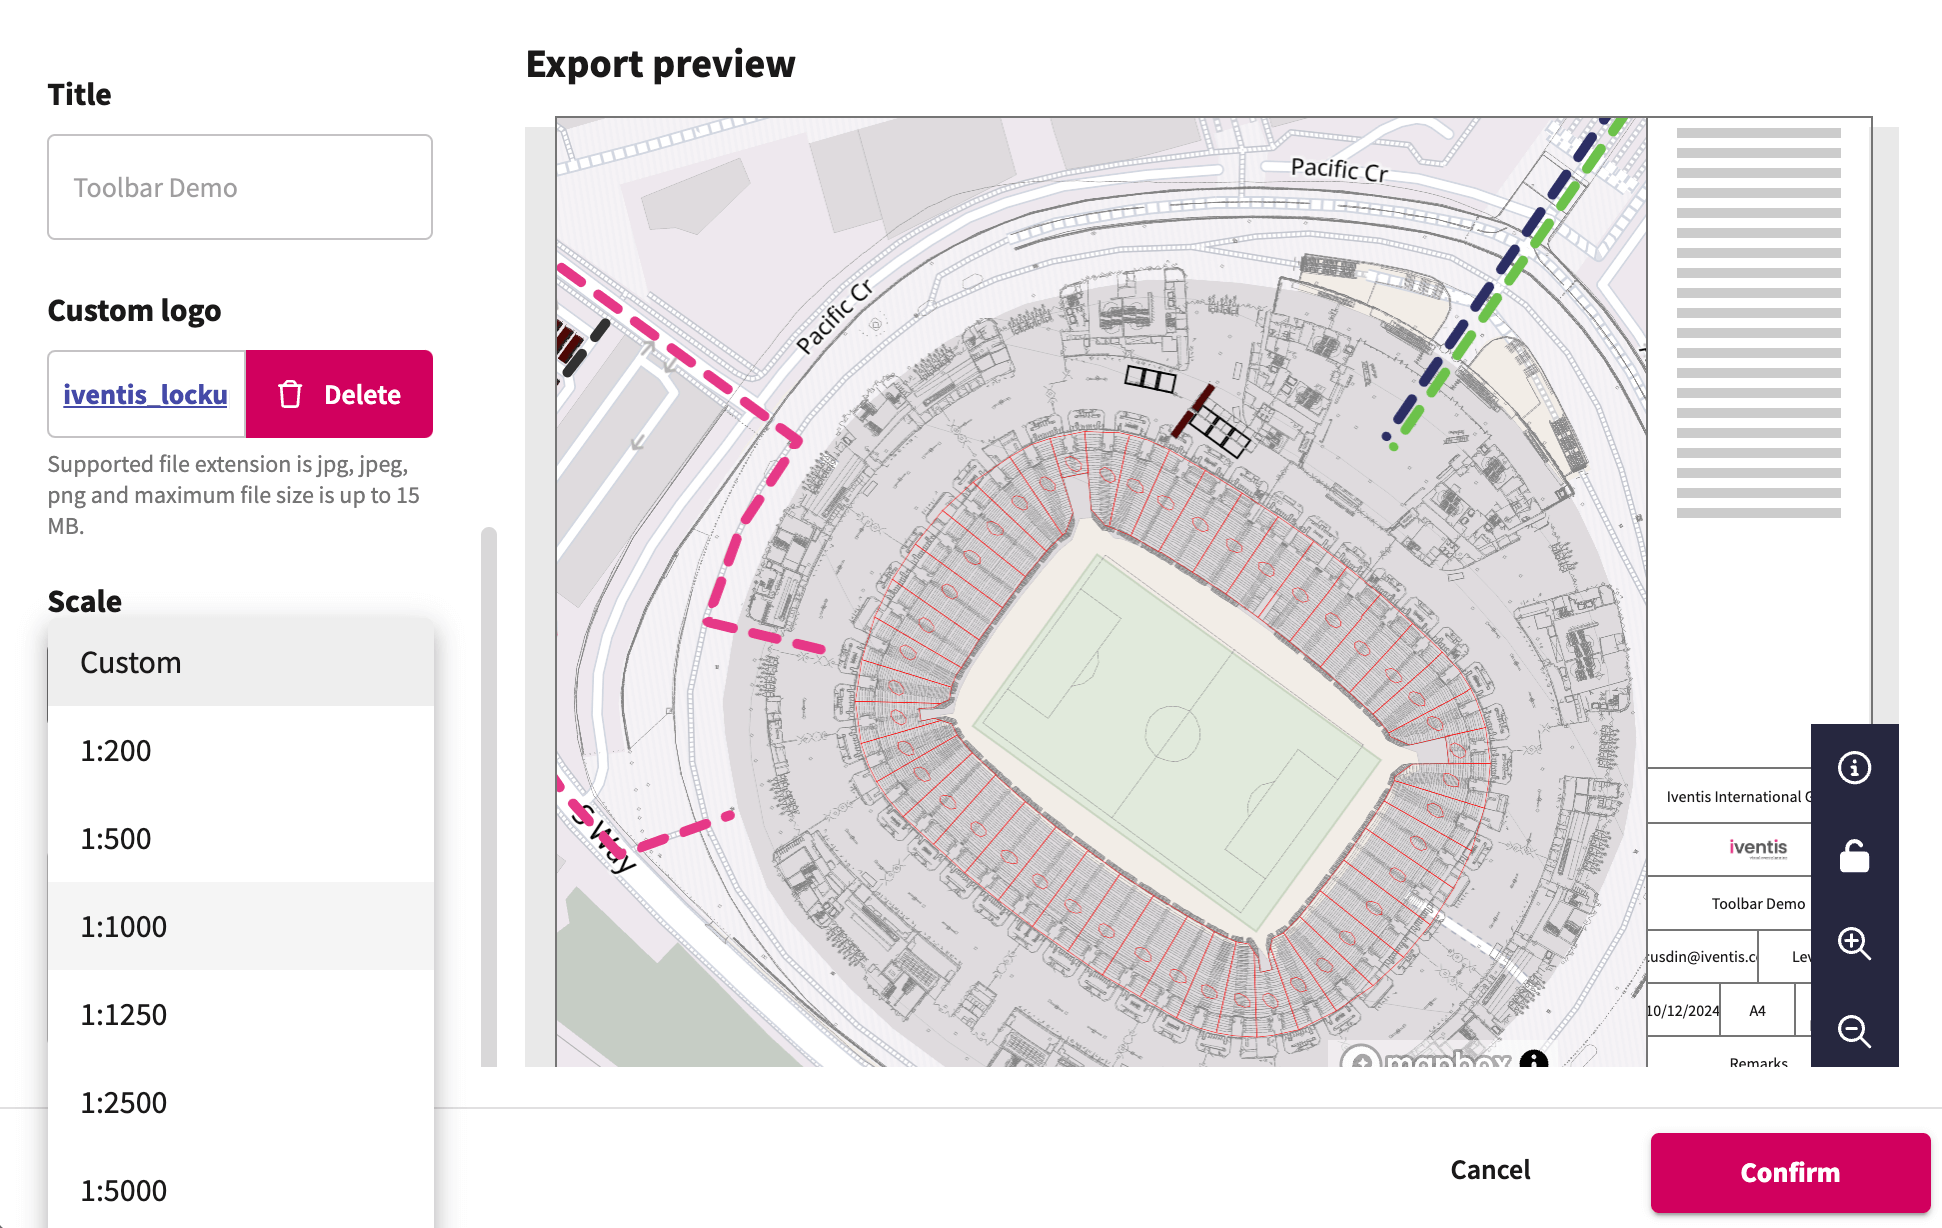
PDF exporting has been enhanced so users can export at specific scales (e.g. 1:1250), customise the title and image shown in the title block.
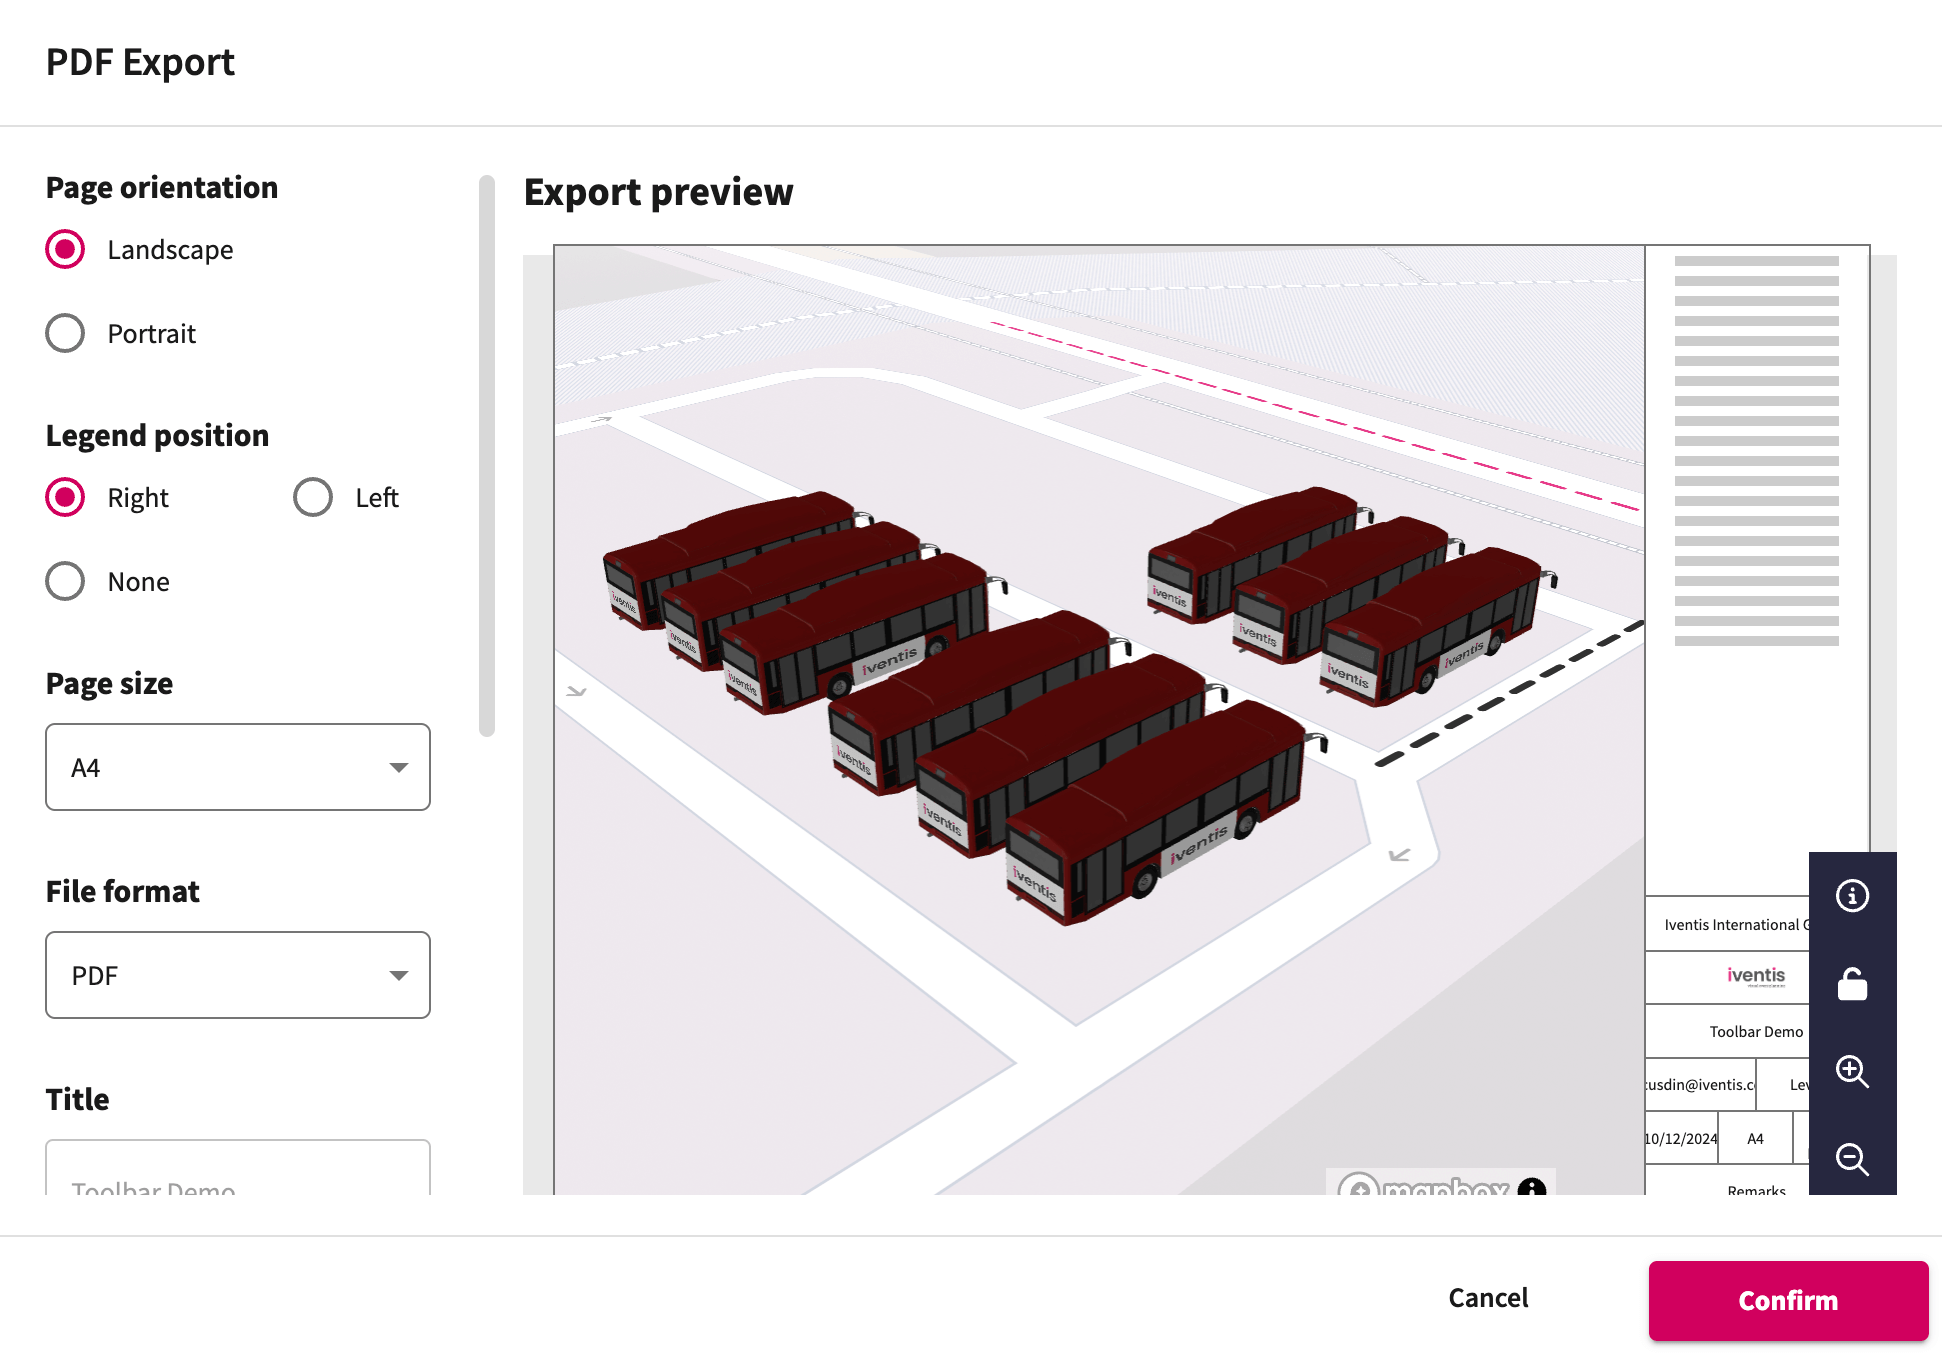
When exporting a PDF, the map can be tilted at an angle which is useful when showing 3D plans.
“We were happy to team up with such a renowned company as Iventis which significantly supported our team in their planning and delivery. The system was used across several functional areas to develop plans and co-ordinate our efforts in the run up to the event.”

“The Iventis mapping software has been instrumental with plotting, measuring and storing the relay route on a secure platform. It allows relay planners to use the mapping software as a development tool, creating and amending the routes. Additionally, it allows for multiple user groups, with various access rights, to view or edit plans and see real-time route amendments. Plans can be shared via a link or exported in KML and PDFs files.”